Quality Measurement Index ® Survey
A Fully Integrated Diagnostic Procedure
ABBREVIATED SAMPLE
FEEDBACK REPORT
(Actual reports include the latest revisions to the Baldrige Award criteria)
The Quality Measurement Index® (QMI) is the copyrighted property of Assessment Technologies Plus. Any inquiries about use, scoring, and interpretation of this report should be directed to:
Fred Westfall, Ph.D., 15 Pebble Beach Drive, Shalimar, FL 32579
Phone: 1-850 609-8075 FAX 1-850-609-8075
SAMPLE CLIENT'S NAME
Quality Measurement Index
Table of Contents
Section (TAB)
Executive Summary
Overview
The attached report provides you with feedback and recommendations from your Quality Measurement scores. The profile of scores from the quality survey should provide excellent for the development of improvement plans and resource allocation.
This section of the report summarizes the results of the quality surveys. Section Two will profile your highest and lowest scores in quality management, representing current quality strengths and weaknesses in the organization. Section Three of this report outlines our recommendations for actions to attack weak areas in quality management. Section Four describes the demographics of the employees who participated in this quality survey. Sections Five through Eleven contain the detailed comparisons of each element of your quality measurement scores to both similar organizations and Malcolm Baldrige National Quality Award winner scores. Section Twelve contains your estimated score on the Baldrige Examination. (Winners score in the 900 point range.)
Quality Measurement Index
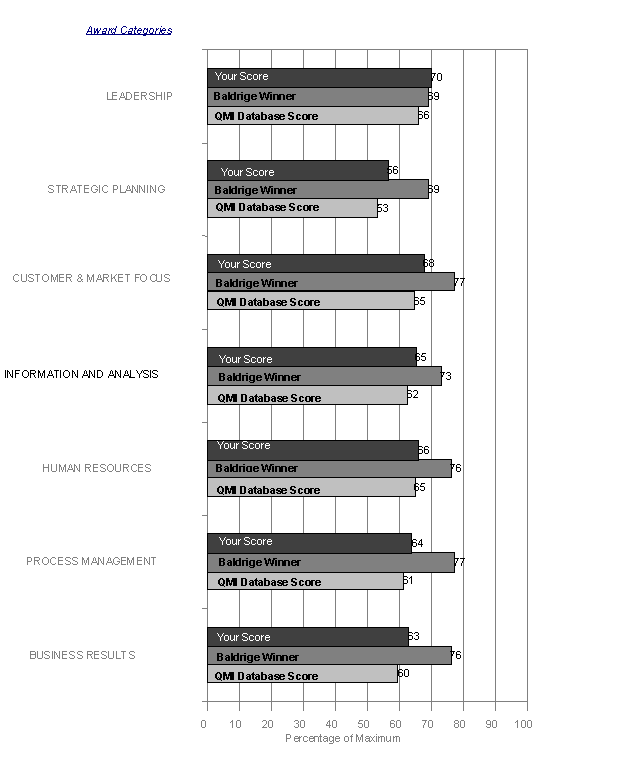
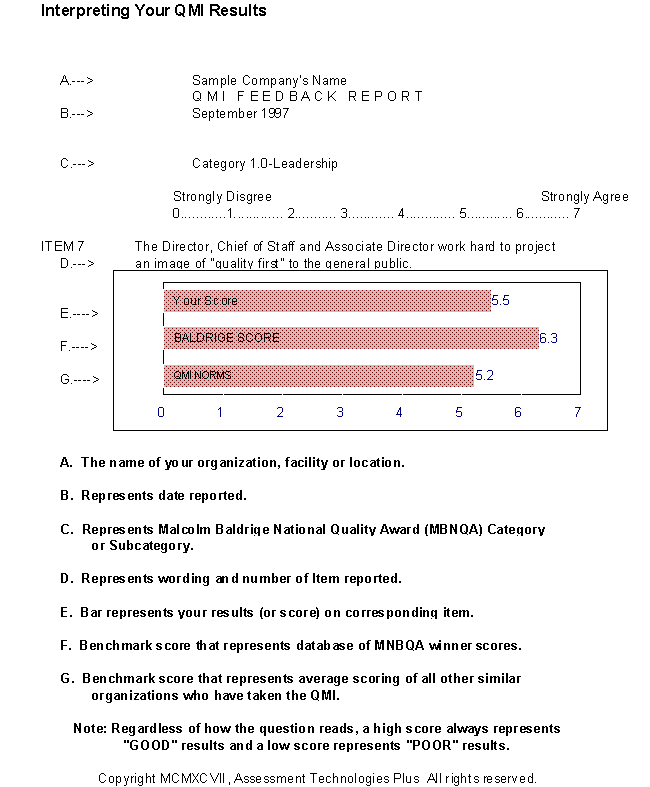
The quality Measurement Index (QMI) data collected from {number of responses) managers and employees was consistent across the organization. The results present a clear profile of strengths and current weaknesses from which your managers and employees can plan appropriate actions. At the end of this section, Figure 1 is a bar chart of how well CLIENT'S NAME met the "maximum" points for each category of the Malcolm Baldrige National Quality Award. Each of the seven bars represents CLIENT'S NAME score divided by the maximum points available for that particular category. This figure can be used to identify areas of relative strength and weaknesses. For instance, CLIENT'S NAME scored better in Leadership, Quality Assurance, and Customer Relations. CLIENT'S NAME scored poorer in Quality Planning, Information and Analysis, Human Resource Utilization, and Quality Results. Section 2, Quality Measurement Index High and Low Scores, will provide you with the rank order of the highest and lowest scored questions on your particular QMI. The following Strength and Weakness sections will provide you with some general findings, but you will need to analyze the specific Quality Measurement Index (QMI) questions in Sections 5 through 11 to truly understand your specific strengths and weaknesses, for several of the issues which cross specific categories.
Strengths
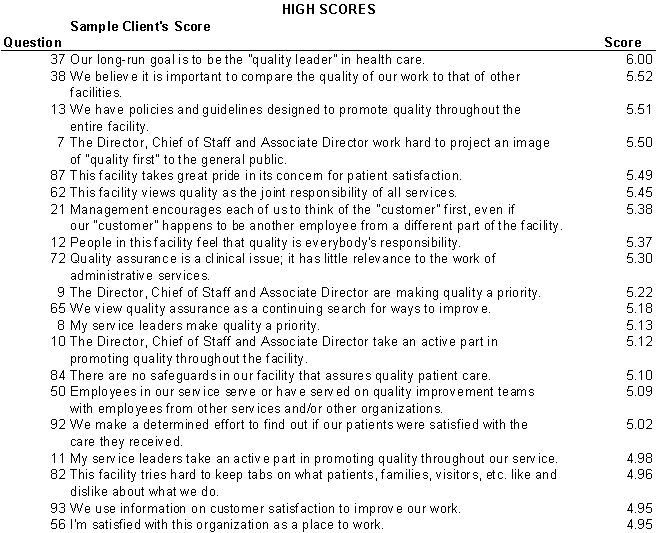
CLIENT'S NAME strengths are determined by the scores received on individual questions from your Quality Measurement Index results. Those question numbers are indicated in the parentheses after each statement. Your strengths revealed in the evaluation are those characteristic of an organization that is strong in product quality but appears unsure about its positioning to continue improvement efforts. It is most definitely CLIENT'S NAME’s goal to be the quality leader in the industry. (41) Managers and employees have heard this message consistently and have come to believe it. (7) Senior management takes the lead in making quality and customer service a priority. (92, 21) As a result, the entire organization takes great pride in customer satisfaction. (13, 92) Along with the deeply held desire to be a quality and customer service leader in your industry, individuals throughout the organization believe strongly in benchmarking current performance against other companies. (42, 72)
Employees are satisfied with CLIENT'S NAME as an employer. (61) Throughout the organization individuals indicate a willingness to comply with company quality policies and guidelines. (13) Employees work hard to check the quality of their products and continuously search for ways to improve the quality of the product itself. (48, 104) As you would expect in a total quality management approach, individuals in the organization view quality as an integrated responsibility of all departments. (68, 77, 21)
Areas For Improvement
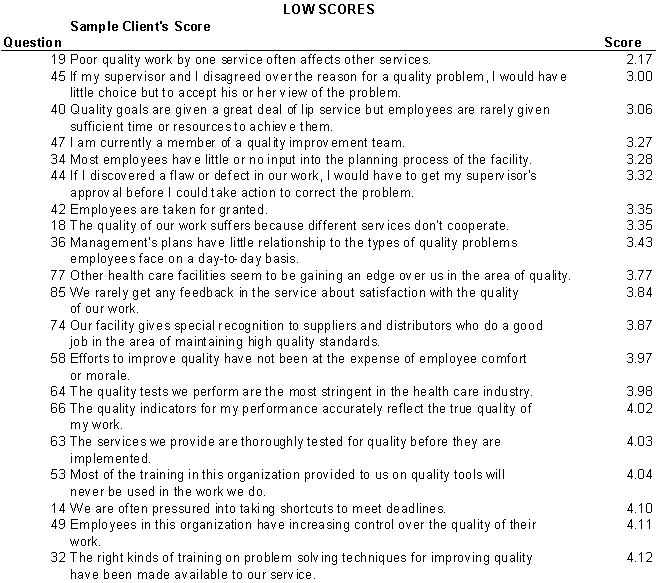
The QMI Survey evaluation pointed out a number of areas needing attention if CLIENT'S NAME is to make any progress toward attaining excellence in total quality management which can lead to sustainable competitive advantage. Surprisingly, there was little reported involvement by employees in quality planning and goal setting. (36) As a result, employees believe that senior managers’ plans had little relationship to the day-to-day issues and problems they faced. (40) As you know, one of the best predictors of continued excellence in total quality management is the degree of employee understanding and commitment to the strategic quality objectives of the organization. Employees become committed to these objectives to the extent they are involved i the planning and enactment of the objectives themselves. Your scores would indicate an overall deficiency in the involvement and trust your employees have in the planning process.
In the critical areas of team based continuous improvement and employee involvement the survey indicated current widespread deficiencies. Individuals throughout the organization indicated that the quality of products and services suffers because people in different divisions and departments are not able to cooperate. (39) This is especially interesting in that your employees indicated earlier that they believe quality at CLIENT'S NAME is a function of interdepartmental cooperation. Together these findings indicate that although individuals in CLIENT'S NAME recognize the importance of cooperating across cross-functional boundaries, they are not able to make such cooperation a working reality. As a result, they judge that the quality of products and services suffer. (18)
The survey indicates that you do not have in the organization high levels of employee involvement in continuous improvement. Employees said that to a significant extent they feel taken for granted. (46) Additionally, they indicated that quality goals were not consistently acted on because of inadequate time or resources. Employees reported that, for the most part, they were not members of quality improvement teams (27) Training in SPC was not well utilized in actual work situations. (58) Finally, employees indicated that supervisors were not necessarily open to their input in defining and solving quality problems (27) Altogether, team based continuous improvement has not reached its full potential.
CLIENT'S NAME
EXECUTIVE SUMMARY HIGHLIGHTS
Quality Measurement Index-Strengths
Quality Measurement Index-Weaknesses
Recommendations
RECOMMENDATIONS
Based on your Quality Measurement Scores, comparisons to our database scores, and extensive research from successful quality programs of similar organizations to yours, our recommendations for CLIENT NAME include:
Recommend:CLIENT'S NAME commence a broadly participative quality planning and objective setting process. Critical Success Factors should be deployed down through the entire organization. Objective setting and planning should occur at each organizational level to meet the overall Critical Success Factors. In this way, "top down" direction setting will meet with "bottom up" planning to more completely integrate CLIENT'S NAME’s improvement planning process.
Recommend:CLIENT'S NAME offer middle managers and supervisors a broader array of training modules in change management, facilitation, coaching and goal setting. Supervisors, middle managers and foremen should receive training and development in coaching. The content should assist these key employees to facilitate teams, encourage collaboration, clarify goals, increase team competence, influence planning, innovate and problem solve, reward performance, break down cultural barriers and lead goal setting and improvement efforts. The result will be increased team focus and confidence in the team’s ability to improve cross-functional processes. Ownership and satisfaction will also result. Altogether, the outcome will be higher performance for the organization in every aspect of quality and service.
Recommend:Charter a task force to dramatically reduce cross-organizational barriers to quality cooperation and performance. Survey results indicate such strong barriers in this area to merit this focused approach to problem solving.
Recommend:Perform a Pareto/Cause-and-Effect analysis on barriers to information timeliness in support of continuous improvement. Unless quality data and documentation is available when and where it is needed, it will continue to be difficult to see any real improvement in quality or employee ownership and participation.
Recommend:Dramatically increase the number of process related improvement teams throughout the organization. Allow these teams sufficient training and time to study and improve critical processes. The number and effectiveness of cross-functional process related teams should be significantly increased. Teams should be designed around whole processes, drawing members from associated functions and departments. Team charters should stress cross-functional cooperation and mutual goal setting. The surveys indicate that these teams will need training not only in the technical aspects of process management but also goal setting, conflict resolution, and interpersonal communication.
Quality Measurement Index Feedback Report
September 1997
Category 7.0-Business Results
Strongly Disgree - - - - - - - - - - - - - - - - - - - - - - - - - - - - - - - - - - - - - - - - - - - - - - - Strongly Agree
0............…...1…................. 2…............... 3.…............... 4…................ 5..…............. 6.................. 7
Category 7.0-Business Results
Subcategory 7.5: Company-Specific Results
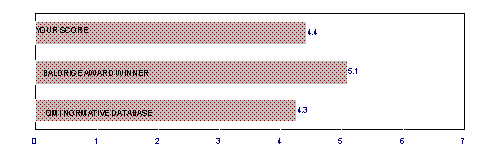
Item 75: The quality of our work is currently the best it has ever been.
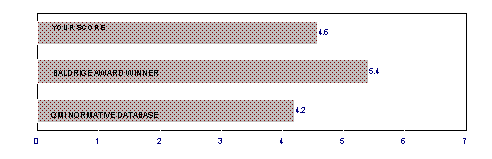
Item 81: Quality improvement teams have done little to improve the quality of our work.
Subcategory 7.4: Supplier and Partnering Results
Item 79: Our suppliers make little effort to cooperate with us in order to improve quality.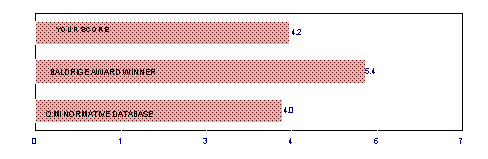
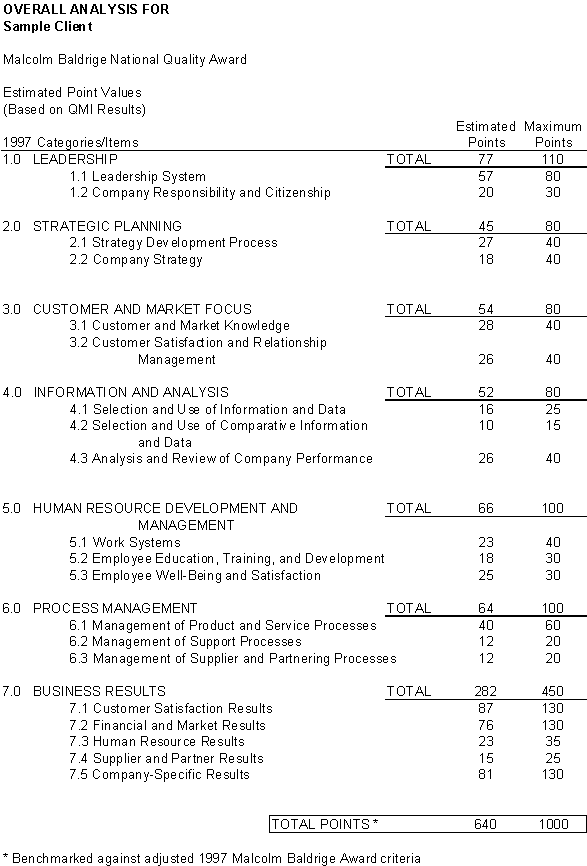
Estimated Malcolm Baldrige National Quality Performance Criteria Estimated Points